Managing data used to be a very difficult task back in the days. It would consume a lot of time to store even the simplest of data. As we make technological advancements, managing data becomes more complicated as the magnitude increases every day. If you are running a business, each user’s data is stored onto your servers and with every new user, the size increases. This is inevitable and the only way to stop it from increasing is basically to wall off new users, but as a business that is not an option. Every customer is valuable and so is their data. Database management is essential if you wish to run a network without any downtimes and errors that might impact your user base.
For that purpose, you will have to monitor your database’s performance at all times. If one of your database malfunctions, the servers will not be able to retrieve the requested data in time and hence become unresponsive. All of the servers rely on the data stored in the database. If they are not able to access that, then, what good is the stored information anyway? Therefore, deploying a monitoring tool on your network to help you monitor your database’s performance can reduce the number of issues you face significantly. Hence, in this article, we will be using the Database Performance Analyzer tool developed by Solarwinds to show you how you can monitor your database and resolve issues in real-time. So, without further ado, let us get into it.
Installing Database Performance Analyzer
The first step is, of course, to install the DPA tool on your system. For this purpose, head to this link and click on Download Free Trial to begin your evaluation. Once you have submitted the requested form, download the tool for your operating system and then follow the steps provided below:
- After the download, extract the .zip file to any directory you like. Move to that directory and run the SolarWindsDPASetup-x64.exe file to start the setup wizard.
- Once the setup wizard loads up, click Next.
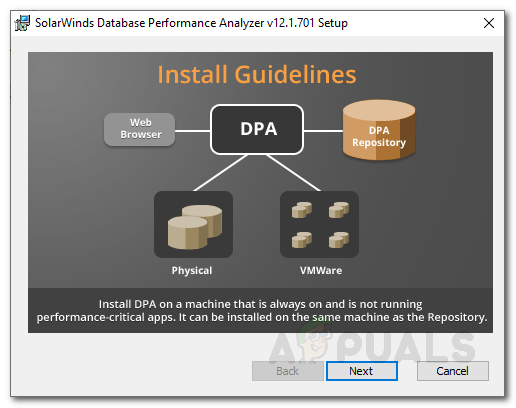
DPA Installation - Click Next again and then agree to license agreement. Hit Next.
- Choose the installation directory of the tool by clicking Change. Then, click Next.
- Hit Install to begin the installation process.
- Once the tool has been installed, click Finish.
Creating the Repository Database
After installing the Database Performance Analyzer tool, you will have to create a repository database for DPA. This repository database will store the performance data collected by Solarwinds Dabatase Performance Analyzer as well as store the user credentials. Here’s how to create a SQL Server repository database:
- Once you install the tool, open up a web browser. Type in the ServerNameorIP:8123 or ServerNameorIP:8124 in a new tab and hit Enter.
- Click on ‘Create New DPA Repository’.
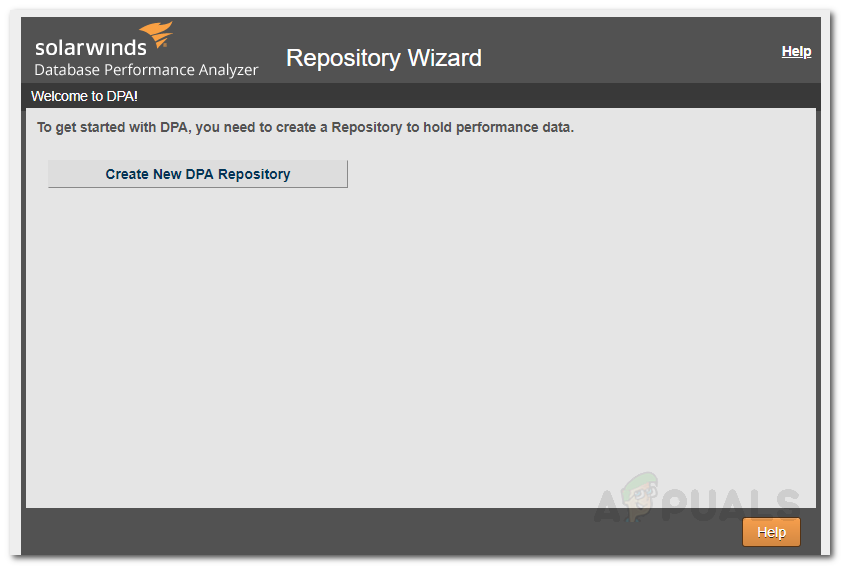
Repository Wizard - Select the database type and then click Next. Since we are creating a SQL Server repository, so we are going to select Microsoft SQL Server.
- Enter the server’s IP address and the port number. After that, choose the type of authentication you want. Provide the required credentials and click Next.
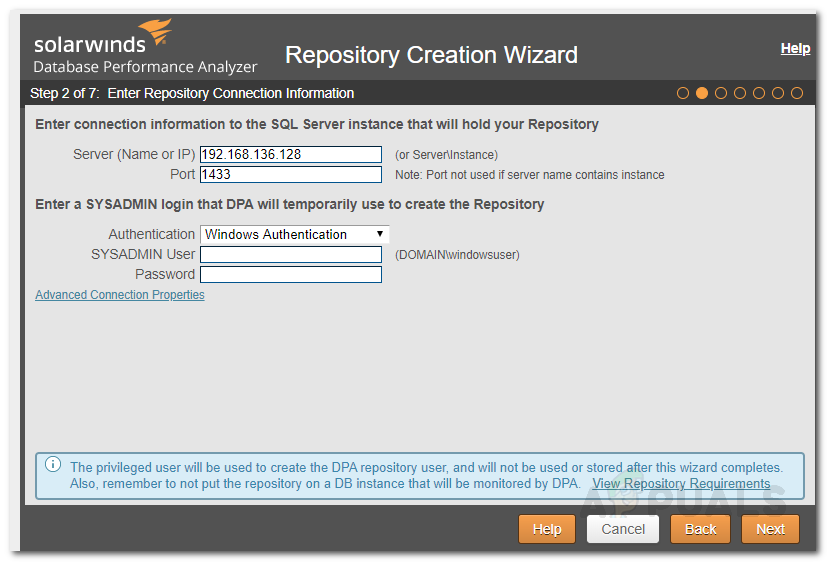
Repository Connection Credentials - Create a new account for the repository database by specifying a username and password. Then click Next.
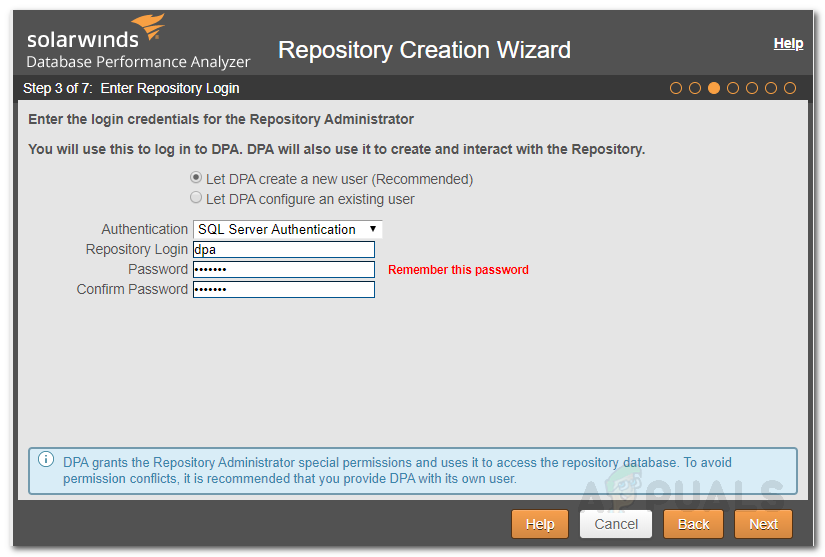
Repository Login - After that, select an existing database or create a new one. If you create a new database, the prefix dpa_ is added with it for identification purposes.
- Provide your name and email address for performance reports.
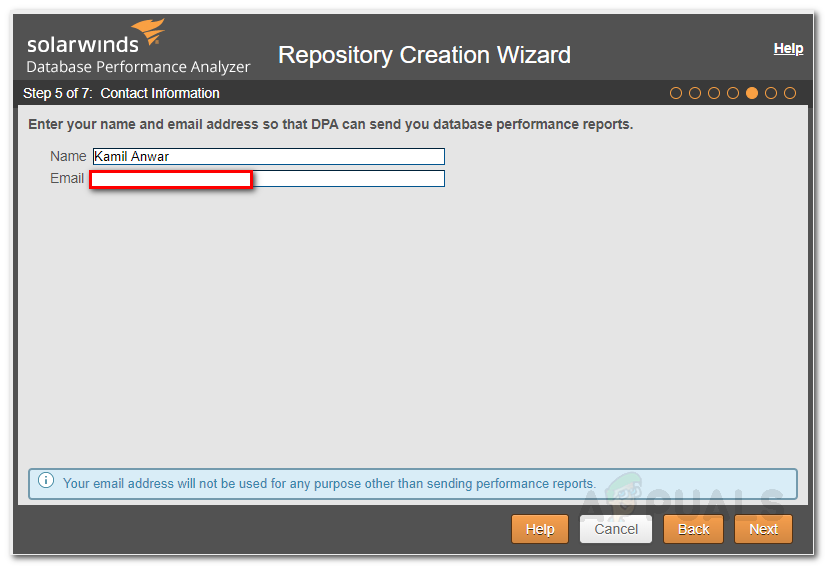
Contact Information - Review the summary and then click Create Repository.
- Wait for it to complete creating a repository database.
- Once done, you will be asked to register database instances for monitoring. Click on the button.
Registering Database Instances
Now that we have set up a repository database where all the Database Performance Analyzer data will be stored, it is time to register database instances that you wish to monitor. For this, we will be using the Register Instance Wizard. Here’s how to do it:
- When you finish creating a repository database, you will be automatically asked to register database instances. Click on that button to go to the ‘Register Instance Wizard’. If the wizard doesn’t start automatically, you can load it up by clicking ‘Register DB Instance for Monitoring’ option on the top-left of the DPA homepage.
- Select the type of database instance you wish to monitor and then click Next.
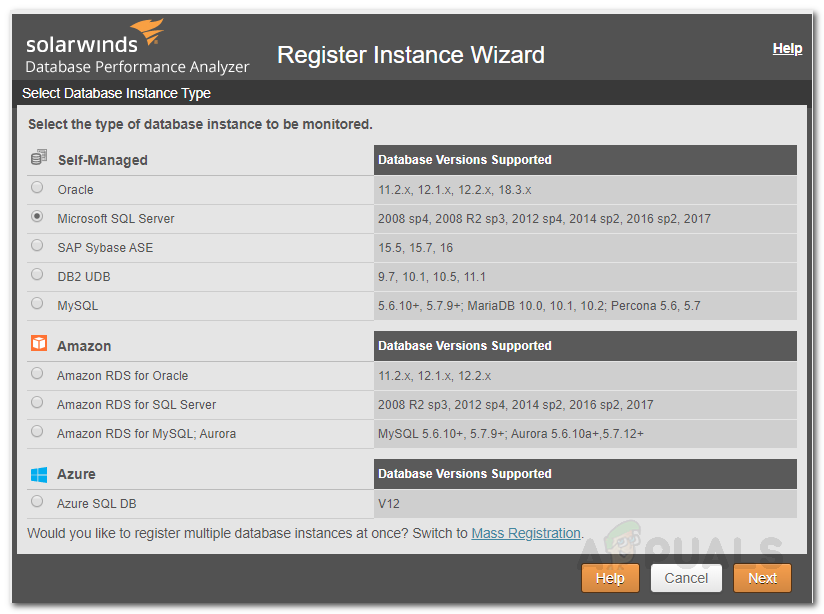
Register Instance Wizard - Enter the server IP address and port for the SQL Server to be monitored. Choose a type of authentication and then provide the credentials. Then, click Next.
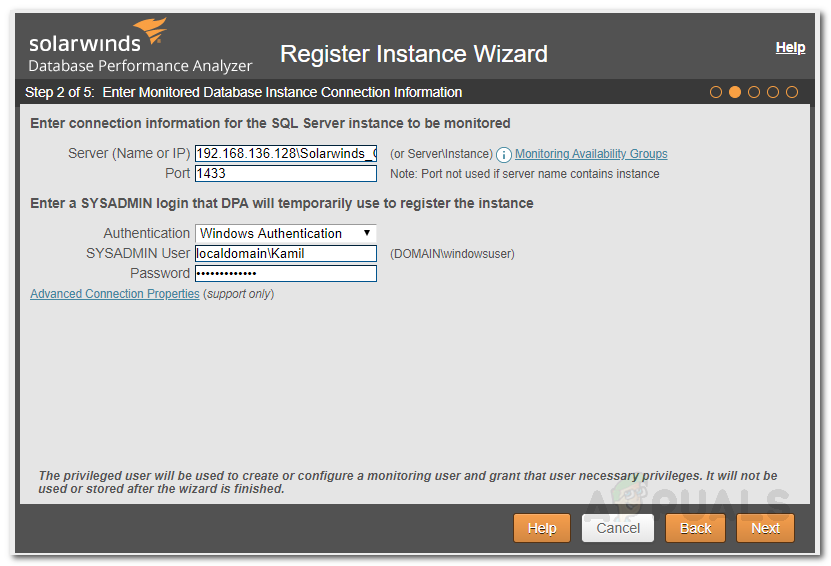
Instance Connection Credentials - Enter the account that will be used by Database Performance Analyzer to monitor the instance. It is recommended that you create a monitoring account. To do that, just select SQL Server Authentication as the Authentication type and then provide a password.
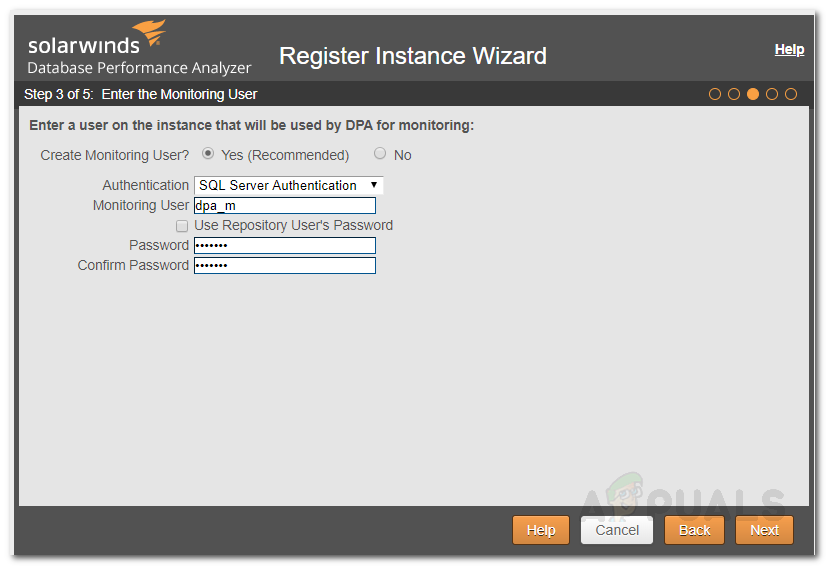
Monitoring Account - Preview the summary and then click Register Database Instance.
- Wait for the instance to be registered and then click Finish.
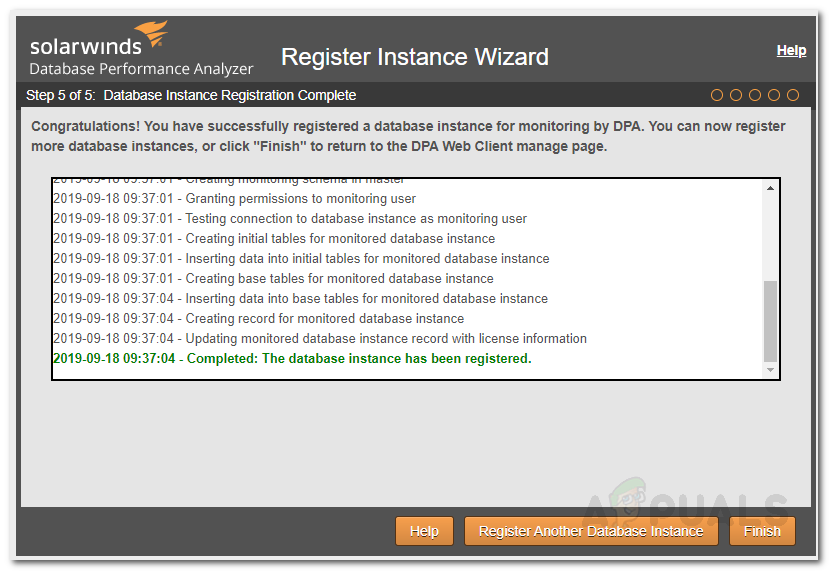
Instance Registered
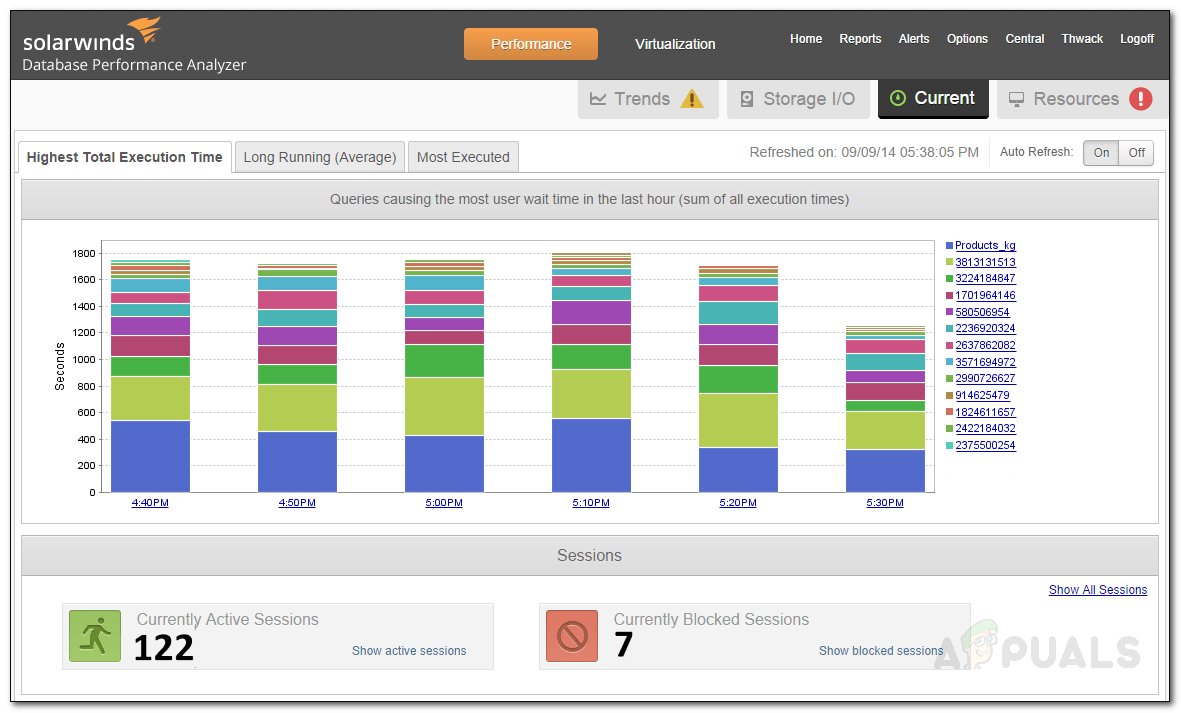
Start Monitoring
With that, you are all set and you can start monitoring your database instance. If you wish to register further instances, you can do so by clicking on Options and then Register under Database Instances. To monitor a database instance, go to the homepage, click on that database instance and you will be good to go.